Silver Basic Statistics
Last updated: 2025-02-25
Compiled from USGS MCS 2026 and selected public supplements. Domestic U.S.-only notes are excluded where possible.
1. Highlights & Overview
- World production (2025) is approximately 26,000 t.
- Global reserves are approximately 610,000 t.
- The largest producer is Mexico, accounting for about 24.2% of global output.
- In 2025, Mexico ranked among the top producers (6,300).
- The top 3 countries account for about 51.2% of global output, indicating concentrated supply.
- Source: USGS MCS 原文PDF
- Source: World Silver Survey 2025
2. Price Trends & Global Market (Events, Trends, and Issues)
- The estimated average silver price in 2025 was $38 per troy ounce, 34% higher than the average price in 2024.
- The price began the year at $29.35 per troy ounce, which was the yearly low.
- The price increased for 11 months in 2025 and reached a high of $53.60 per troy ounce on November 13.
- The continued supply deficit was cited as a reason for price increases in 2025.
Usage Mix (Based on Public Data)
3. World Mine Production and Reserves
Top Producing Countries(2025, Top 5)
Top Reserves (Top 5)
| Country | Production(2025) | Reserves |
|---|---|---|
| Mexico | 6,300 | 37,000 |
| Peru | 3,600 | 110,000 |
| China | 3,400 | 67,000 |
| Bolivia | 1,500 | 22,000 |
| Chile | 1,400 | 33,000 |
| Poland | 1,300 | 59,000 |
| Russia | 1,200 | 92,000 |
| United States | 1,100 | 23,000 |
| Australia | 1,000 | 91,000 |
| Argentina | 800 | 6,500 |
| India | 800 | 8,000 |
| Kazakhstan | 630 |
Unit: トン
4. Supply-Demand Balance Trend
Unit: Moz / Positive values indicate supply surplus; negative values indicate supply deficit.
5. Metallurgical & Physical Properties and Industrial Uses
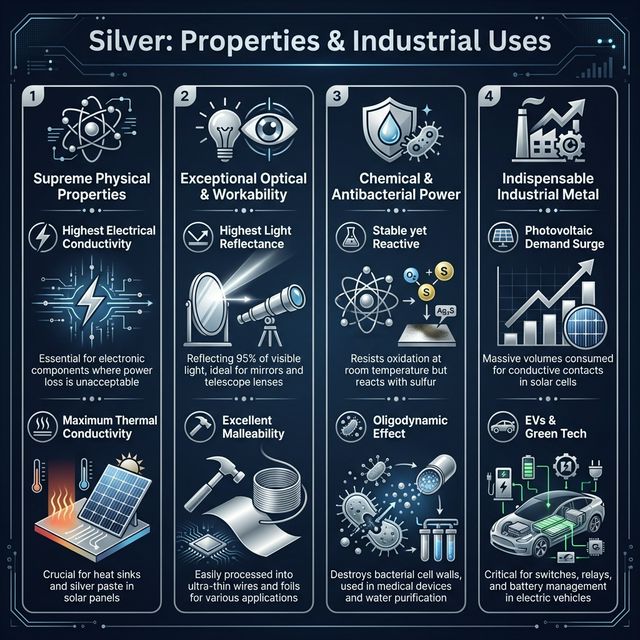
Silver (Ag) is a precious metal that boasts physical properties uniquely superior to those of all other industrially utilized metals. The primary reasons and characteristics behind its industrial use are detailed below.
First is its "supreme electrical conductivity." Silver exhibits the lowest electrical resistance among all metals, boasting an outstanding conductivity that surpasses even copper and gold [9]. Because of this trait, it is indispensable in precision electronics where even the slightest power loss is unacceptable—such as in electrical contacts, switches, connectors, multi-layer ceramic capacitors (MLCCs), conductive pastes for ICs, mobile phones, and automotive electrical components [9].
Second is its "supreme thermal conductivity." Its ability to transfer not just electricity but heat ranks at the very top among metals, playing a vital role in heat sinks and cooling systems for electronic devices. In recent years, it has been heavily relied upon as a silver paste in photovoltaic (PV) solar panels, critical for thermal management as well as electrical collection [9].
Third is its "excellent light and heat reflectance." It has the highest reflectance for visible light among all metals (over 90%), and it also reflects 98% of infrared radiation [9]. Therefore, it is utilized as reflective material in lighting fixtures, thermal control films (insulation) in satellites, and as thin-film mirrors and optical coatings for telescopes [9].
Fourth is its "high malleability and ductility." It is the softest metal next to gold, making plastic deformation—such as rolling it incredibly thin (foil) or drawing it exceptionally fine (wire)—extremely easy [9]. This allows for its processing into complex-shaped contact materials and ultra-fine wiring [9].
Fifth is its "high corrosion resistance." As a noble metal, it does not react easily with oxygen, and its surface state remains stable. While it does have a tendency to tarnish by reacting with hydrogen sulfide in the air (sulfidation), this doesn't typically result in severe degradation of conductivity via oxidation, making it highly favored for silver plating on highly reliable electronic contacts [9].
Sixth is its "antibacterial and sterilizing power." Silver ions (Ag+) bond with the cell membranes and enzyme proteins of bacteria, destroying their functions to deliver a high sterilizing effect [9]. This property is applied to medical devices (coatings for bandages and catheters), filters for water treatment systems, antibacterial/deodorizing clothing, and even pharmaceuticals [9].
Lastly is its "chemical catalytic properties." It exhibits extremely high catalytic efficiency in specific chemical reactions. An prominent example is its widespread use as a catalyst in manufacturing ethylene oxide, a raw material for plastics and textiles, for which the process of recovering silver from spent catalysts is well established [9].
Reflecting these traits in the U.S. end-use consumption breakdown for 2023, barring physical investment (34%), advanced industrial applications dominate demand: electrical and electronics (27%), coins and medals (13%), photovoltaics (10%), jewelry and silverware (6%), and brazing alloys and solders (3%) [9].
6. Structural Issues Governing Supply and Demand
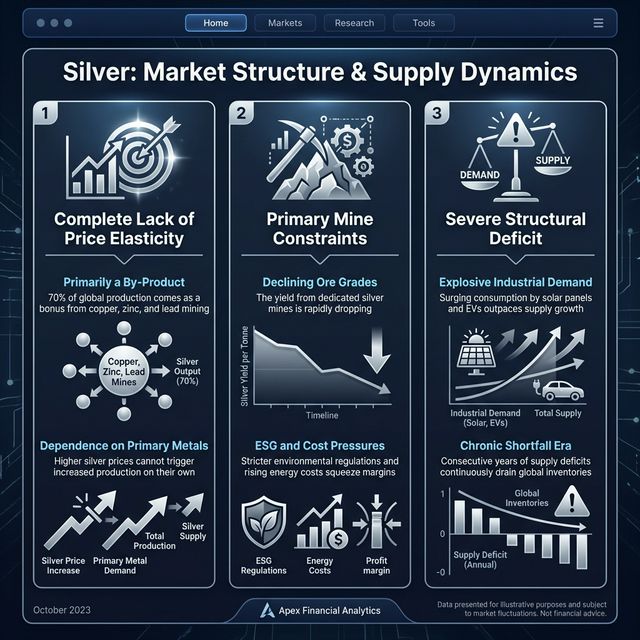
To understand the supply-demand dynamics of the silver market, one must grasp two critical structural peculiarities: the complete lack of price elasticity in supply, and silver's nature as a by-product of other metals mining.
In recent years, industrial demand for silver has surged to unprecedented levels, driven primarily by the explosive growth in photovoltaic (solar panel) applications within the green economy. According to the Silver Institute's "World Silver Survey 2025," global industrial silver demand is projected to exceed 700 million ounces (Moz) for the first time in 2025, a 3% year-on-year increase[10]. With such surging demand and historically high prices (e.g., from $57 to $83 per ounce), one would expect mining companies to ramp up production aggressively. Indeed, the average production cost of silver mines in 2024 was $14.58/oz, suggesting substantial margins. Yet in practice, silver output does not increase dramatically.
The primary reason is that over 70% of global silver production is a by-product of other base metal mining. Only about 28% comes from primary silver mines. The remainder is extracted from copper mines (~28%), lead-zinc mines (~23%), and gold mines (~22%)[12]. Mining operations are planned and operated based on the economics of their primary commodity (copper, lead, gold, etc.), which accounts for over 50% of each mine's revenue. Silver is merely a side product; it is economically impossible to increase copper or lead mining volumes solely to boost silver output[12]. As a result, roughly 70% of the world's silver supply is entirely unresponsive to silver price signals.
Even within the remaining 28% from primary silver mines, production increases are difficult. Mining companies strategically prioritize extending mine life over maximizing short-term output. When silver prices rise, rather than mining high-grade ore, companies tend to process lower-grade deposits that were previously uneconomical, reserving rich veins as insurance against future price declines. Data from the 12 largest primary silver mines (representing 16% of global output) over the past decade confirms a consistent downward trend in average ore grades[16].
This mismatch between inelastic supply and surging green economy demand has pushed the silver market into a fifth consecutive year of structural deficit in 2025[10]. Above-ground inventories are dwindling, and elevated lease rates — a sign of physical tightness — have become the norm. The simultaneous collision of investment and industrial demand against supply constraints defines the current silver market's most distinctive structural challenge[10].
This structural supply constraint becomes even more apparent in country-level production forecasts. According to analysis by the Japan Bullion Market Association (JBMA), global silver mine production peaked at approximately 28,000 tonnes in 2016 and has since declined at an average annual rate of about 1.4%, falling to roughly 25,315 tonnes by 2023[17]. While a temporary recovery to approximately 25,688 tonnes (+2% YoY) is expected in 2024, with output potentially rising to around 26,621 tonnes by 2027, existing mines are projected to enter a significant decline phase starting in 2029.
Mexico's trajectory is particularly alarming. As the world's largest silver producer, accounting for roughly one-quarter of global output, Mexico is forecast to see production fall by approximately 13% (839 tonnes) by 2029, dropping to around 5,566 tonnes[17]. The key drivers are ore depletion and eventual closure of flagship mines including Fresnillo plc's San Julián and Fresnillo mines, and First Majestic Silver's La Encantada mine. Peru is expected to add approximately 311 tonnes of new production, but this is far from sufficient to offset Mexico's decline; the top five producing countries (Mexico, Peru, China, Chile, and Bolivia) will see a net decrease of 590 tonnes combined. Furthermore, new silver mine projects with a high probability of reaching production by 2030 are extremely limited — notably Endeavour Silver's Terronera mine (Mexico) and Adriatic Metals' Vareš mine (Bosnia) — highlighting the lack of new supply sources as a critical medium- to long-term challenge[17].
References
- [9] Silver - Mineral Commodity Summaries 2024 - USGS.gov
- [10] Global Silver Market Forecast to Remain in a Sizeable Deficit in 2025 - The Silver Institute
- [12] SILVER SUPPLY & DEMAND - The Silver Institute
- [16] (PDF) Are the World-Leading Primary Silver Mines Exhausting? - ResearchGate
- [17] JBMA Metals Weekly Report 2025年2月1日号 - 日本貴金属マーケット協会